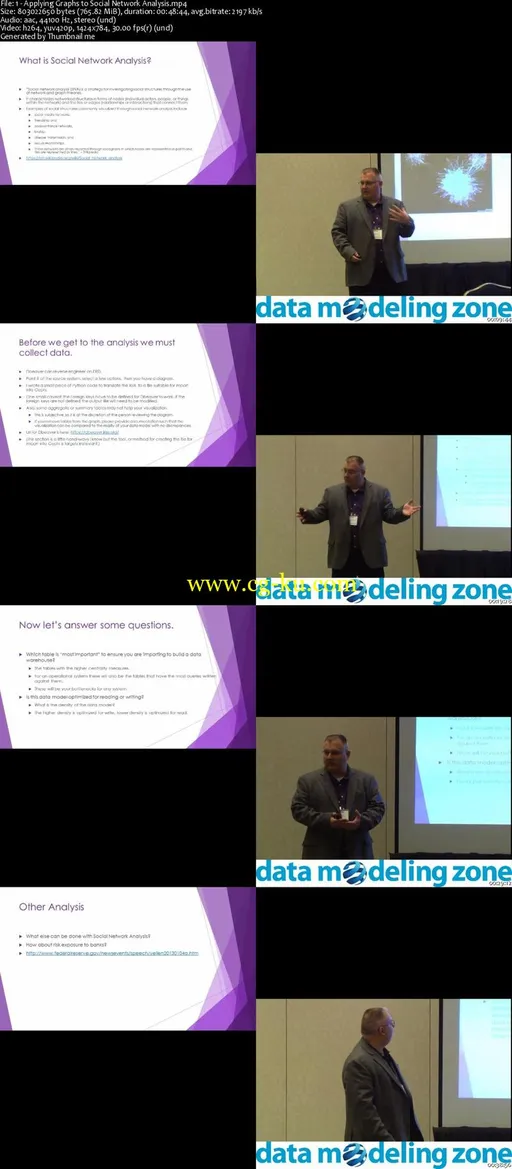
MP4 | Video: AVC 1280x720 | Audio: AAC 44KHz 2ch | Duration: 48M | 765 MBGenre: eLearning | Language: EnglishSocial network analysis is the mapping and measuring of relationships and flows between connected entities.
In a traditional data model such as an Entity Relationship Diagram, the tools like Erwin or SQL Developer data modeler show a visual relationship of our Tables, along with the Foreign Keys that tie the entities together.
Doing a graph analysis of the data structures that our data models represent yields what I call a Data Structure Graph.
By interpreting a data model as a graph there are mathematical concepts and techniques like centrality, graph density, and isomorphic properties that can be used to anticipate usage trends, and find optimal performance footprints of a data model.
In this talk, I will show the data modeling practitioner the benefits of applying graph theory to the practice of data modeling.
These techniques provide for some new perspectives on traditional relational data modeling.
They can abstractly evaluate the efficacy of a data model as well as anticipate performance problems that may arise during a production implementation.
The basic topics I will go over during this talk are:Translating an ERD to a Data Structure Graph.
What to do, and what to avoid.
Determining data model accuracy.
Spotting bottlenecks.
Determining important business keys using a combination of the graph and clustering algorithms.
Prioritizing source to target transformations to build a data mart based on the most important business keys.
Some advanced topics that may be covered depending on time constraints:The various types of Data Structure Graph (Level 1, Level 2, and dependency)How to demonstrate the number of reports your data model can supportThe performance relationship between the data server and the user interface server (Data mart and Business intelligence platform)How A Data Architect can use both a Level 1 Data Structure Graph and a level 2 Data Structure Graph to communicate the movement of data in an enterprise.
How to use the density metric to determine read or write optimization levels.
发布日期: 2017-12-20