Video: .MP4, 1920×1080 30 fps | Audio: AAC, 48 kHz, 2ch | Duration: 1h 25mGenre: eLearning | Language: English + Subtitles | Size: 1.45 GBThis brief course will introduce you to data APIs and third-party Python libraries.
It provides hands-on examples on procuring, cleaning, and analyzing data, allowing you to learn how Python can be leveraged to enhance your statistical analysis.
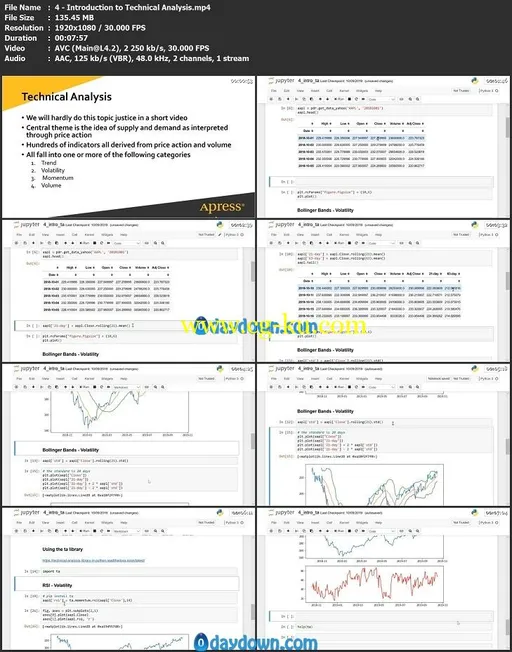
You will make use of NumPy, pandas, and Matplotlib for visualizations and also go through forecasting techniques used in technical analysis.
After gaining insights on data transformation, you will learn to estimate derivative values using Monte Carlo simulation.
Transforming data into information will give you ideas that can be used to take short-term investment decisions.
In conclusion, you will use statistical and technical techniques for analyzing security price movement.
What You Will LearnCreate financial application programming interfacesUse NumPy, pandas, and Matplotlib for data analysis and visualizationApply forecasting techniques to predict derivative valuesExtract and transform data in PythonWho This Video Is ForExperienced Python developers who’d like to leverage the power of Python for financial data analysis and security.